
See it with your own data
Twenty minutes, no slides. We bring a sandbox seeded with something close to your use case. You collect one record and watch it become an indicator, a dashboard and a report.
Are all machines in the computer lab operational?
Single select · required
Field capture · offline, 3 records waiting
What happens in the demo
We prepare your sandbox
Before the call we seed a project with forms, indicators and dashboards shaped like your programme, not a generic demo dataset.
You collect one record
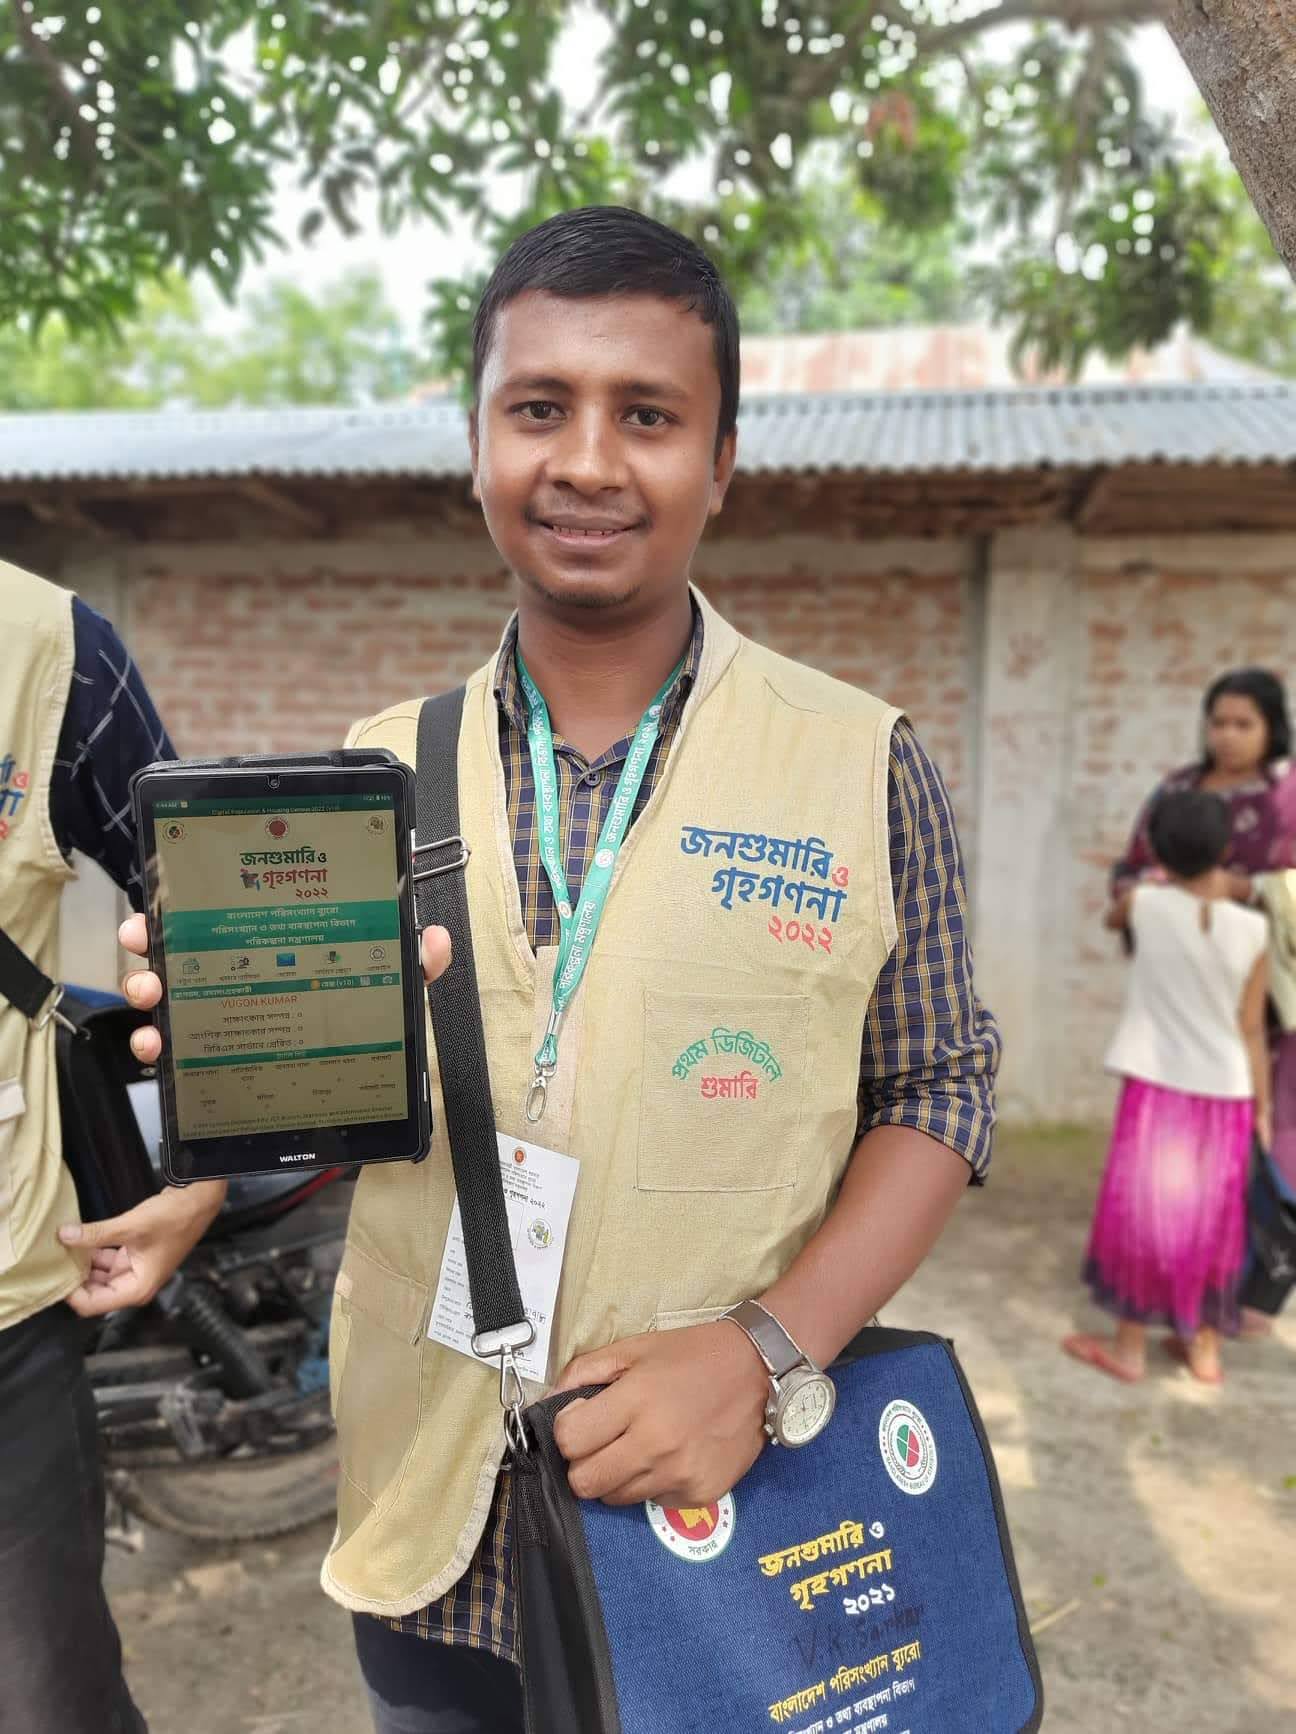
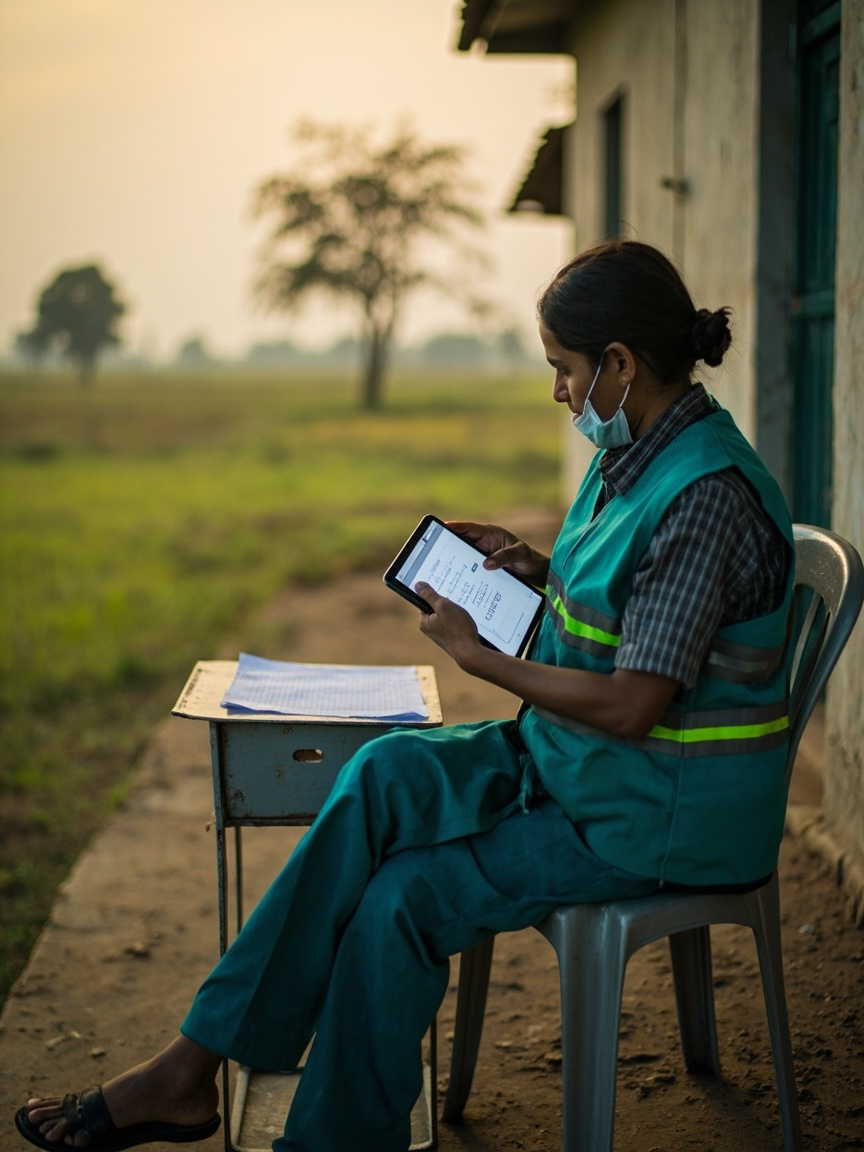
Open the Android app or the web form, fill in a monitoring visit, add a photo and a GPS fix, and submit it.
It becomes an indicator
We show you the same record feeding an indicator value, a traffic light and a trend on the dashboard.
It becomes a report
Finally, the donor report, generated from that same record, with the narrative written for you.
Or skip the call
Start with one project, free. Import a survey you already run and see whether the whole chain holds together on your own data.
No card, no countdown, and your data stays yours.