
What ships, and when
We publish this because M&E teams are often the last to get software and the first to be blamed when it does not work. Here is the plan, in the order we intend to build it.
| Programme | Coverage | Visits | Progress |
|---|---|---|---|
Punjab · Batch 3 8 districts | 3,204 | 8 | 92% |
Sindh · Batch 3 4 districts | 1,488 | 4 | 74% |
Punjab · Takamol 3 districts | 512 | 3 | 58% |
KP · Batch 2 5 districts | 2,015 | 5 | 81% |
Programme roll-up · 7,219 submissions
Phase 1
Months 1 to 3
Collect and see
Everything a first programme needs: a survey builder, an offline Android app with automatic sync, AI survey generation, data quality checks, a review workflow and a full API.
- Survey builder with 30+ question types, skip logic, calculations and XLSForm import and export
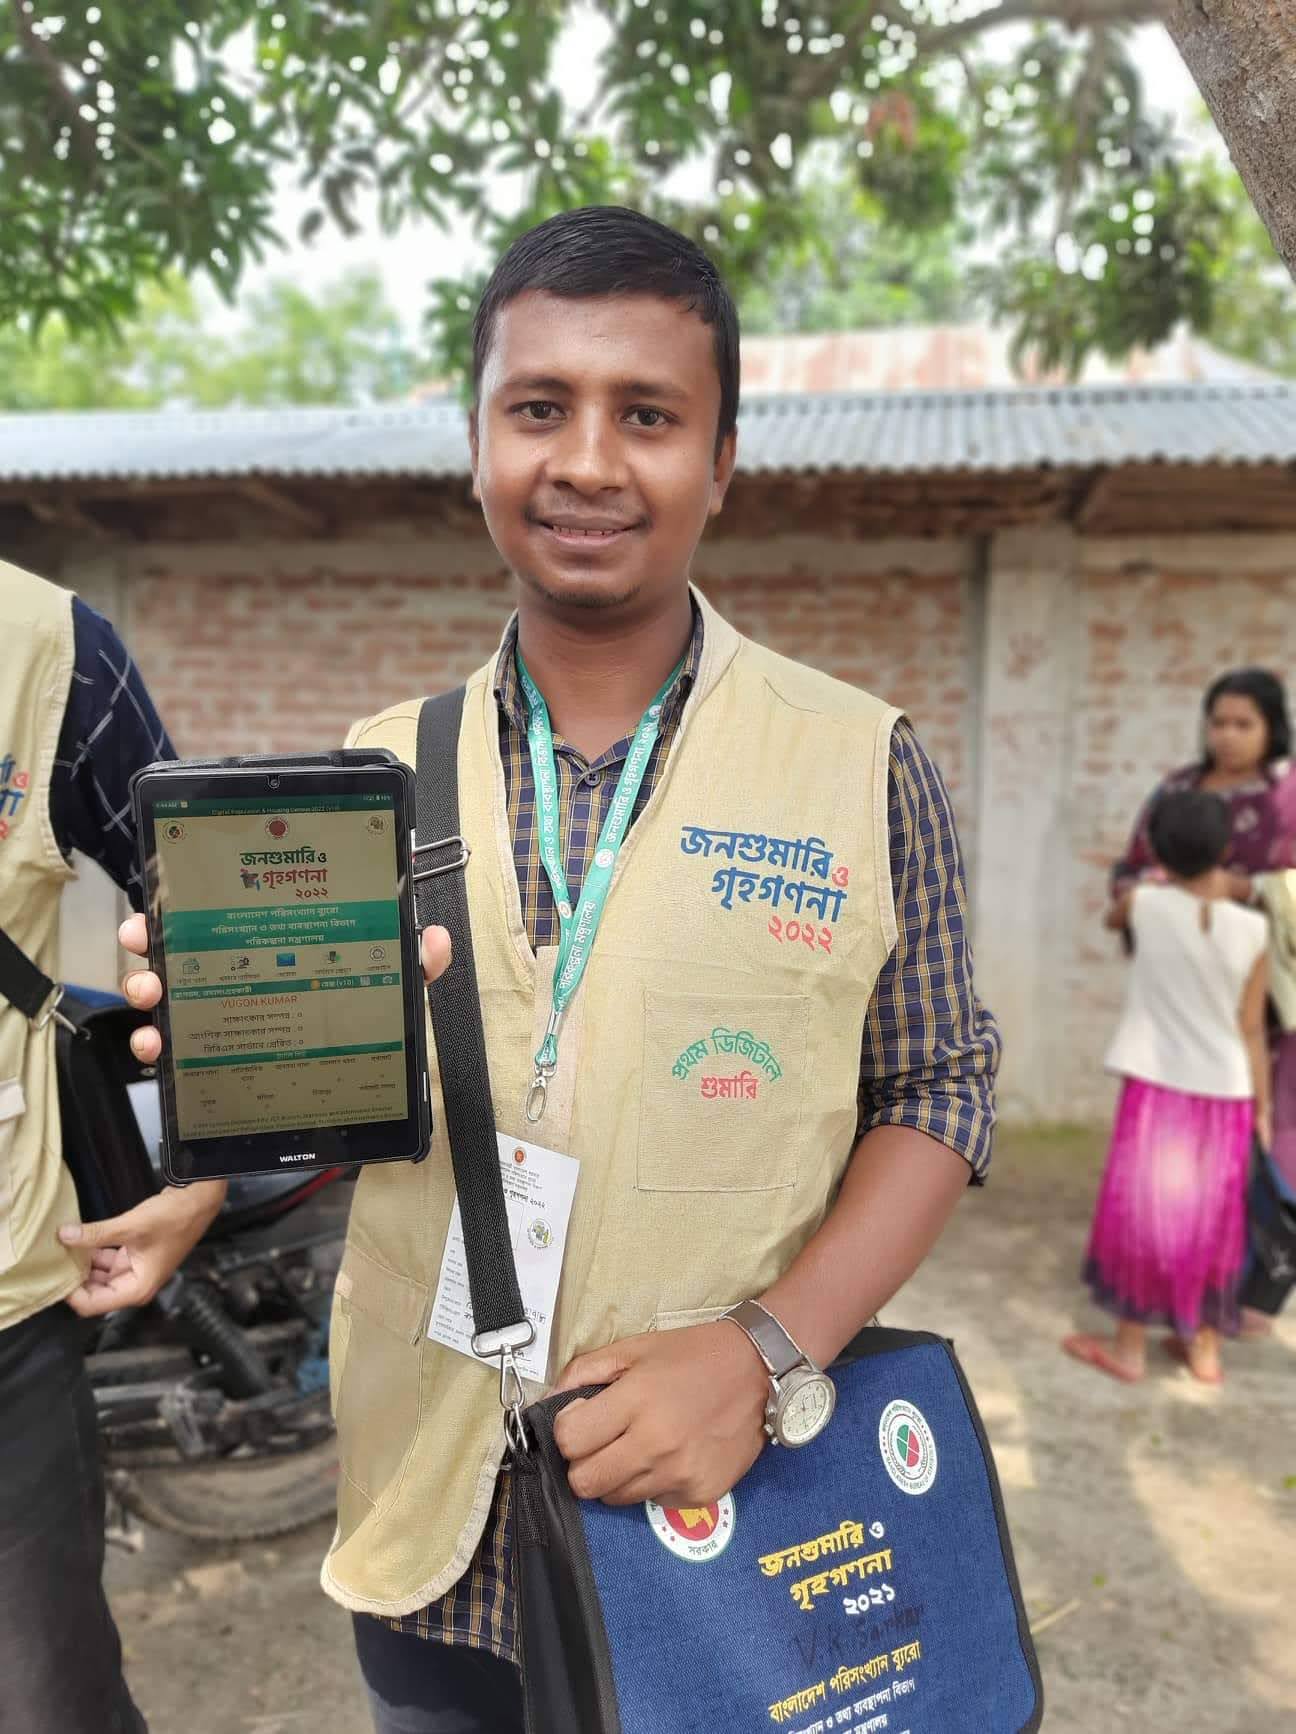
- Android app, fully offline, with background sync, conflict resolution and a media queue
- AI survey generation from a sentence, a CSV, a PDF or a list of indicators
- Data quality: duplicate detection, outlier flagging, missing-value and logic checks
- Review and correction: send a record back with notes and get it fixed
- API-first platform: REST on everything, webhooks, API keys, rate limits and monitoring
- Client-provided datasets, such as facility lists and beneficiary registries, wired into forms
- Multi-country workspaces, monitoring-firm assignment and whole-country dashboards
- Server-side calculations, offline dataset publishing and offline case transfer
- Help centre, in-app tooltips and guided tours
Phase 2
Months 4 to 6
Measure and report
The management layer: a results framework and logframe, indicators that calculate themselves, six dashboard views and scheduled donor reports.
- Results framework, logframe, means of verification, risks and assumptions
- Indicator library with baselines, targets, disaggregation and composite scores
- Six dashboard views: executive, indicator, programme, data quality, geographic and case
- Pivot tables, trend analysis, drill-down, saved views and real-time refresh
- Automated PDF, Excel, Word and PowerPoint reports, scheduled daily, weekly or monthly
- Partner management, and a whole-country view across monitoring firms
Phase 3
Months 7 to 9
Follow and compare
Case management and longitudinal work, done properly: entities, panels, waves and attrition, plus the iOS app on the same codebase.
- Persistent entity tracking for households, students, farmers and institutes
- Panel and wave management for baseline, midline and endline
- Attrition tracking, cohort analysis and follow-up workflows
- Case assignment, case collaboration and offline case transfer
- iOS app on the same codebase as Android
- A/B testing, quiz mode, NPS templates and conversational forms
Phase 4
Months 10 to 12
Ask and verify
Ten AI capabilities across collection, analysis, verification and reporting. Most of the tools in our comparison offer none of them.
- Natural-language querying of your data, with the figures and the caveat about what is missing
- AI cross-tabulation with statistical significance
- Photo compliance verification against a standard
- Voice-to-form in local languages
- Predictive analytics that flag a project before it misses its target
- Automatic report narratives, anomaly highlights, recommendations and translation
- Multi-user AI-assisted survey creation with live co-editing
Phase 5
Months 13 to 18
Govern and scale
Enterprise controls, self-hosting, attestations and a vertical built for your sector, plus the services to roll it out.
- SSO and SAML, white-labelling, self-hosting with one Docker command
- SOC 2 Type II, ISO 27001, GDPR and DPDP attestations
- IATI compliance, donor reporting templates and a form templates marketplace
- A dedicated vertical: education, agriculture, nutrition or rural programmes
- Professional services: onboarding, form design and dashboard building
How we decide
- Field first
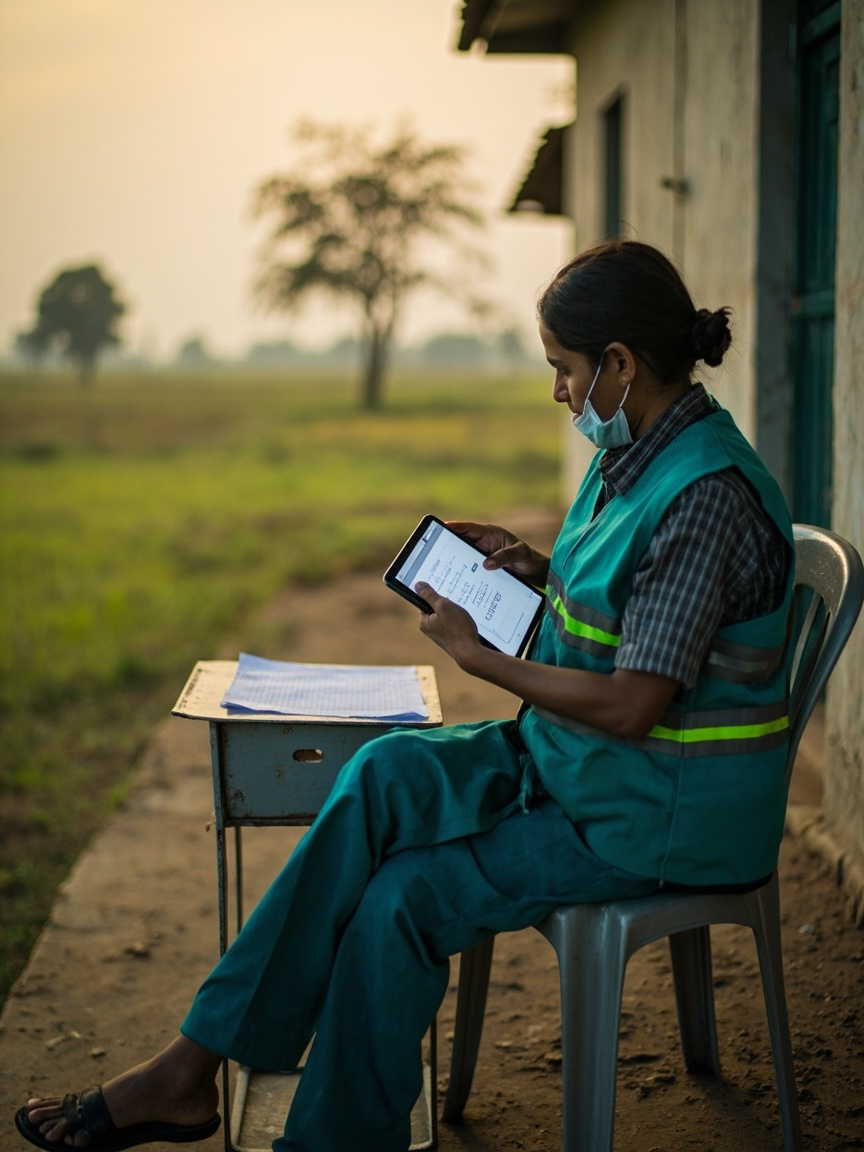
- If a feature does not work offline on a phone in a village, it does not ship.
- One dataset
- If two parts of the product need a spreadsheet to talk to each other, we redesign until they do not.
- Explainable
- Every figure traces back to a submission, a photo and a person who signed for it.
- Open about limits
- When a competitor is the better fit for your situation, we say so on the comparison page.
Executive overview
Indicator performance
Are all machines in the computer lab operational?
Single select · required
Field capture
Attrition 6.4% across all waves
Case tracking

Shape the roadmap
Tell us what your evaluation actually needs and we will tell you plainly whether it is on the list, and when.
No card, no countdown, and your data stays yours.